5 Questions (and 9 charts) on the current state of the U.S. housing market
Several Fed officials have referred to the role of rent increases in the overall inflation picture. There’s also a lot of uncertainty in home purchase markets, what with the direction of inflation as well as the impact of higher rates. Some people say there’s a housing shortage; others point to the rapid pace of home construction over the past few years. I don’t know what to make of all this so I decided to dig into the data and see what they say.
Question 1: Is there a housing shortage in the U.S.?
Doesn’t look like it:
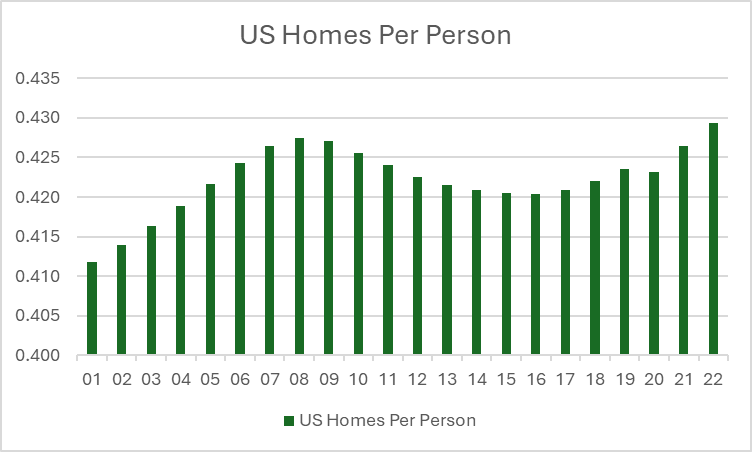
Source: FRED, Census Bureau, World Bank
There may have been a shortage 5 years ago, but right now, we have the highest ratio of homes per person in the U.S. since the turn of the century. There might be localized shortages—e.g., demand for housing in New York City is always going to be high, and supply is always going to be constrained because of scarcity of land—but as a whole, it looks like the U.S. has plenty of houses.
It’s clear the U.S. underbuilt houses for part of the post-2008 crisis period, but it looks to me like homebuilding has caught up. There’s also been a lot of construction in the multifamily space. Zillow’s January 2024 rental trends report says that there’s a lot of new apartment supply coming online, which the data appear to corroborate:
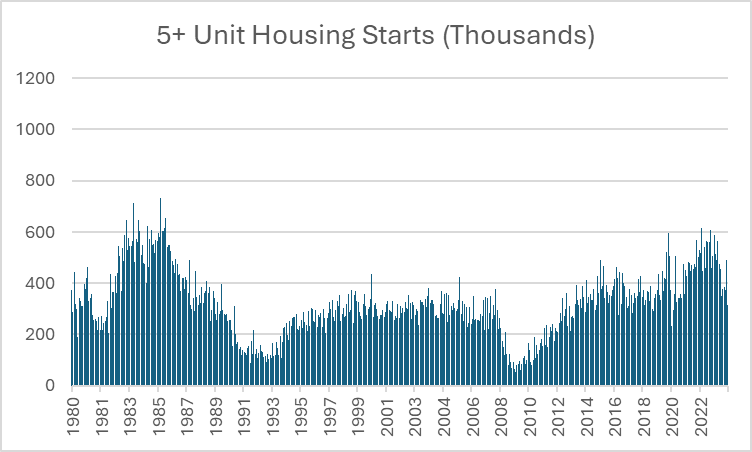
Source: FRED, HUD, Census Bureau
The long-run average for this data print is 367,000 5+ unit dwellings being started per month, going all the way back to 1959. In 2009 the average fell to 100,000 per month (way below replacement rate) so it’s understandable that the underbuilding led to a shortage in housing 5-10 years later. Now we have some catching up to do, but the 2022 average was 531,000 per month and 2024 was still at 463,000 per month despite the higher rate environment. And I’ll bet that the median building being built today is bigger than the median building built in 1980. I think a lot of construction got done during the pandemic period
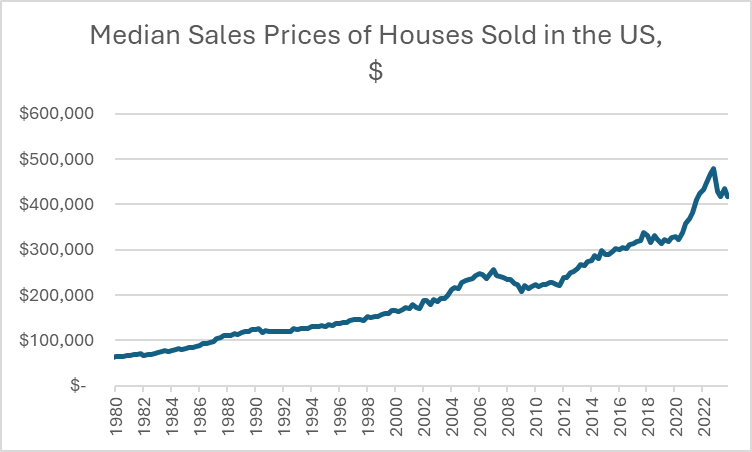
Question 2: What has home affordability been like over the last few years?
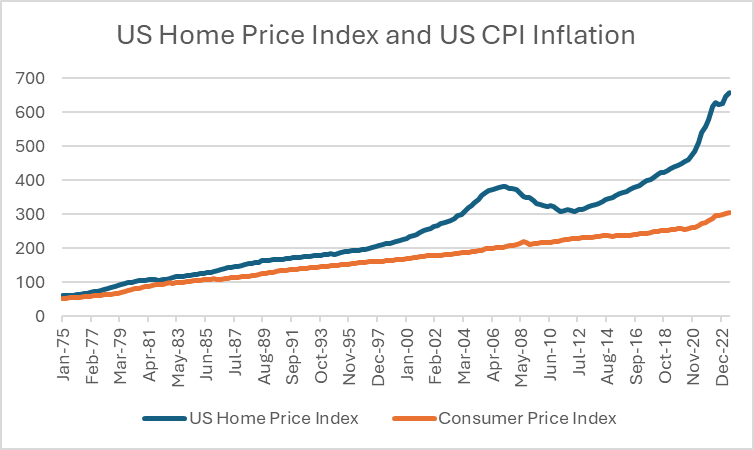
Source: FRED, FHFA, BLS
It’s pretty clear that home prices in the aggregate have risen much faster than the general pace of inflation. However, that doesn’t tell the entire story:
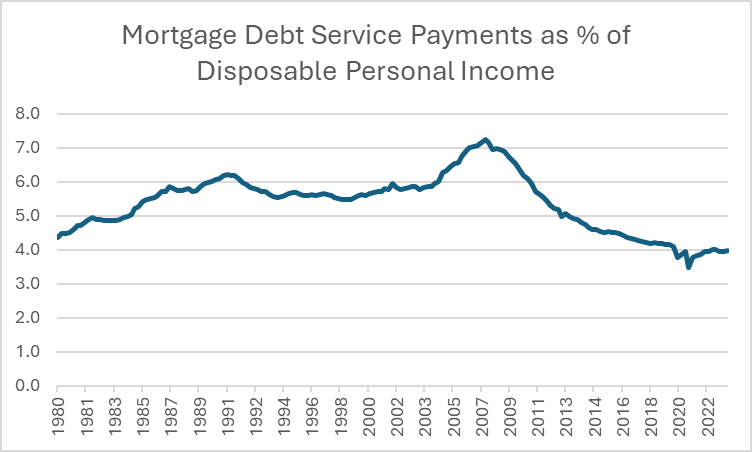
Source: FRED, Federal Reserve Board of Governors
Americans are spending the lowest percentage of their disposable income on mortgage payments today out of any period in the last 40 years. Of course, this particular data series can’t be taken at literal value—nobody I know with a house spends only 4% of their income on their mortgage. This data series divides the total estimate of mortgage payments nationally by the total estimate of disposable income from the national accounts. The national accounts don’t take into account distributional effects—e.g. they include mega-rich people as well as people with fully-paid-off homes. These data tell us that in the aggregate, mortgage debt service is not high compared to the last four decades.
Taken together, these charts make sense when we consider the backdrop to all of this:
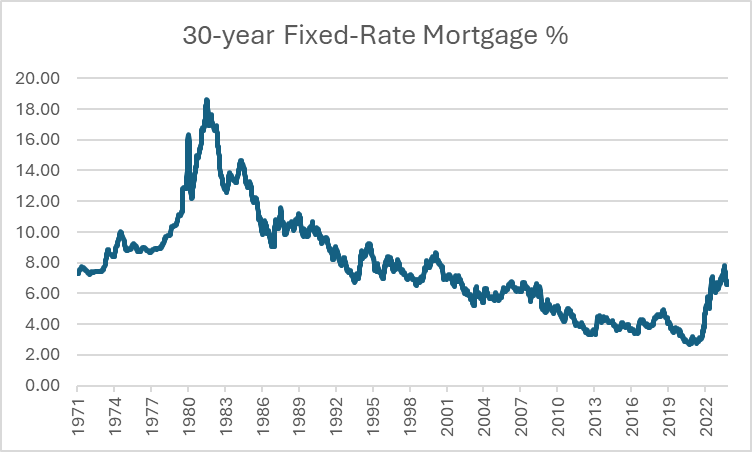
Source: FRED, Freddie Mac
Interest rates have fallen sharply over the last 40 years. This has made mortgages more affordable, and in turn, pushed up the prices of homes (remember, when interest rates fall, asset prices go up.) However, with the recent increases in interest rates, the debt burden for people buying new homes might be significantly higher. In order to match past affordability levels, prices have to come down.
Question 3: Have home prices come down?
It looks like home prices HAVE fallen, at least in the aggregate:
Source: FRED, Census Bureau, HUD
From the peak in November 2022 to October 2023, this data series shows that home prices have fallen about 13%.
Besides absolute price declines, the other way that home prices could “adjust” is that you get a lower price on a new home (meaning the mortgage is more affordable at the new higher rates), but the home itself is smaller. Anecdotally, I’ve heard that from a couple builder friends and the data appear to bear that out:
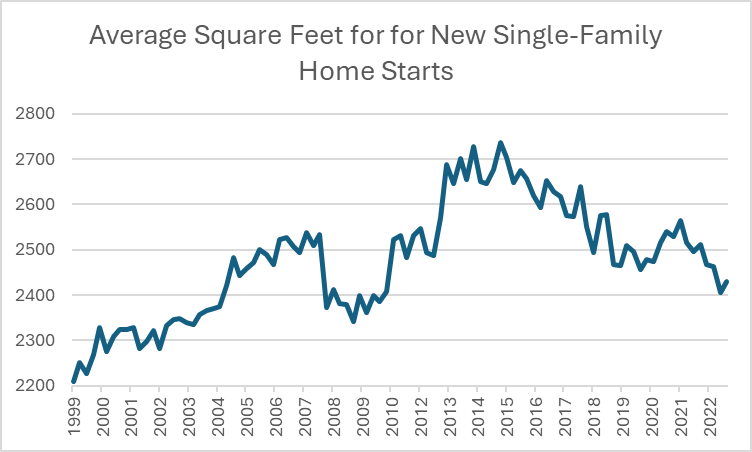
Source: FRED, HUD
So if you’re in the market for a new home, it might be cheaper, but you’re also getting significantly less house at that price.
Question 4: What is going on with rentals?
Doesn’t look like there are a ton of apartments available, at least as of January 2022 (the last observation in this series):
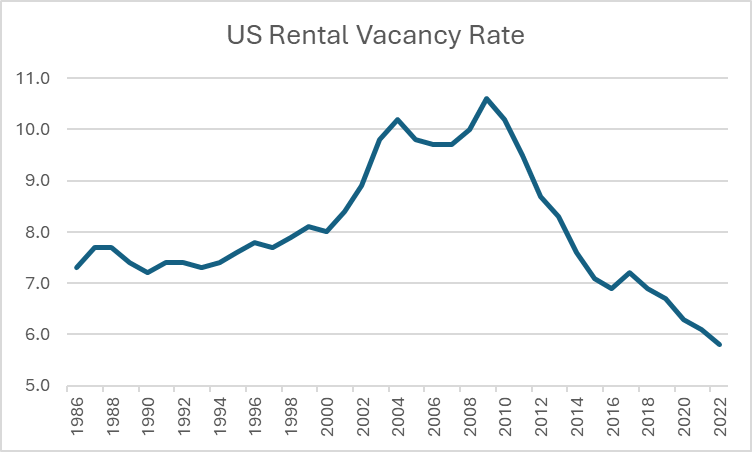
Source: FRED, Census Bureau
However, the absolute count of empty units increased by about 500,000 between Q1 2022 and Q4 of 2023:
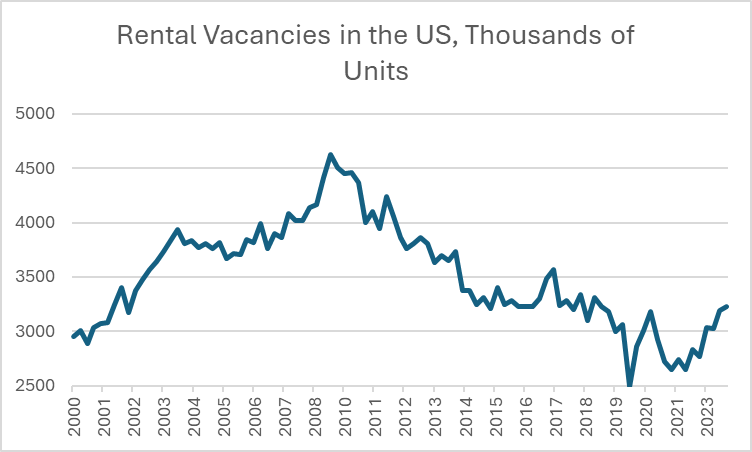
Source: FRED, Census Bureau
Doing some rough math on this, assuming the population has grown by about 1% over the last two years, so 3.3 million new people, and the average household size is about 3 people, we’ve added ~1.1 million new households over the past two years. With a homeownership rate of about 65.7%[1], ~723,000 of those households bought homes and ~377,000 are renters. With ~500,000 new rental units on the market in that time, the vacancy rate should have gone up from the 2022 low of 5.8%.
Anecdotally, I hear that a lot of people who would otherwise be homebuyers are waiting on the sidelines because 1) they think home prices and/or interest rates will come down and 2) renting is much cheaper than buying.
Question 5: Will home prices continue to decline?
I think so.
I’m sticking to my view from last year that home prices have to come down, and as of today, still have another 5-10% of declines. There’s plenty of supply and the interest rate shocks haven’t been fully felt (home prices tend to be sticky as people don’t like selling property at a loss). Rather than a sharp drop, however, what we might see is stagnation in prices for a few years.
My view: home affordability will continue to improve as prices continue to fall, or stagnate, especially if wages and inflation stay where they are.
[1] https://www.census.gov/housing/hvs/current/index.html