How Long Can the Market Remain Irrational?
I've been underweight stocks since 2018, thinking valuations were too high. I was wrong. This is my analysis of what the Shiller CAPE ratio actually tells us about market timing—and what it doesn't. A painful lesson in the difference between valuation and timing, with 150 years of data.
I have been underweight equities in my personal account for much of the time since 2018, on the view that U.S. equity markets were overvalued. Needless to say, I have missed out on a decent chunk of returns that I would have earned if I was balanced or overweight on equities.
In other words, the market stayed irrational longer than I could stay solvent. Rather than let this painful (and expensive) experience go to waste, I’ve decided to try to learn a lesson from it. What did I learn?
Shiller CAPE as a Valuation Metric
I decided to revisit my 2018 decision through the lens of Shiller CAPE, starting with the base rate—when Shiller CAPE is above a certain level (indicating overvaluation), what should I expect about future market returns, knowing nothing else?
First, a histogram of monthly Shiller CAPE observations since 1871 (all data from Robert Shiller’s website):
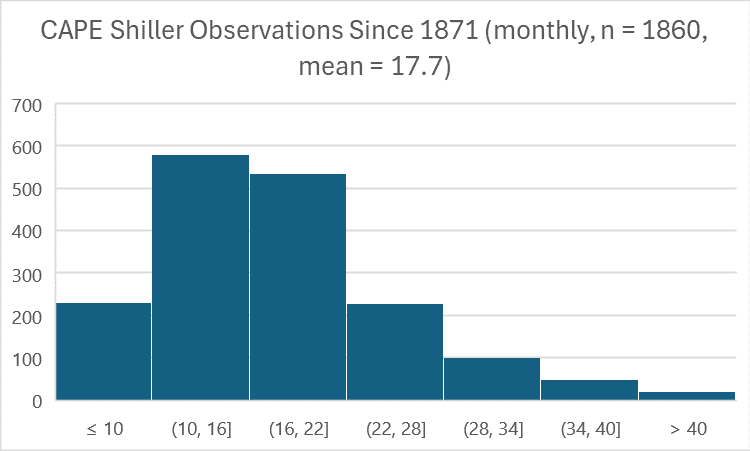
A high Shiller CAPE implies the market is overvalued. Some facts about the distribution, over 1,860 monthly observations:
- The average Shiller CAPE is 17.7 since the year 1871
- The Shiller CAPE was above 28 in 170 months, or 9.1% of the time
- It was above 34 in 69 months, or only 3.7% of the time
- The current level is 39.4 as of Dec 2025, which is in the highest 1.1% of recorded observations
The Shiller CAPE is a reasonably good long-term valuation metric, but a terrible timing tool
Here are four charts showing what subsequent, real returns are for the S&P 500 at different levels of the Shiller CAPE, sorted by 10-year, 5-year, 3-year, and 1-year returns:
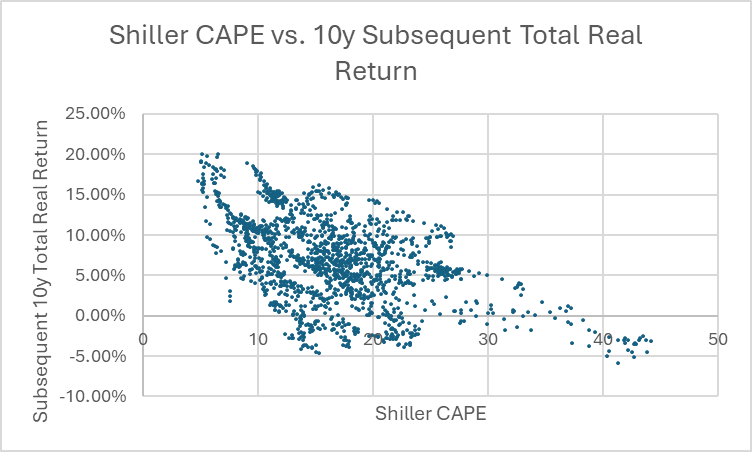
The higher the Shiller CAPE, the lower your 10-year returns are likely to be. But even with a Shiller CAPE above 34, there’s about a 20% chance that you will still have positive returns over the next 10 years.
Let’s look at 5-year returns:
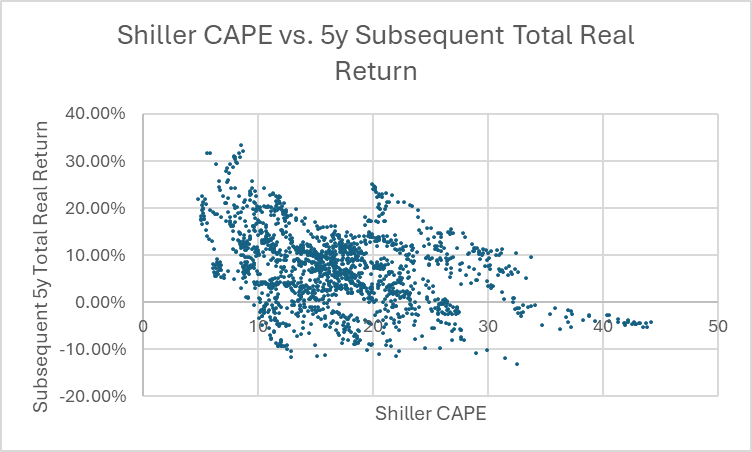
There are no observations where a Shiller CAPE above 34 led to positive 5-year returns. However, if we get no market crash in the next year or two, I suspect positive 5-year returns with a Shiller CAPE above 34 will start showing up in the data, based on buying in during Q1 of 2021.
How about 3-year returns?
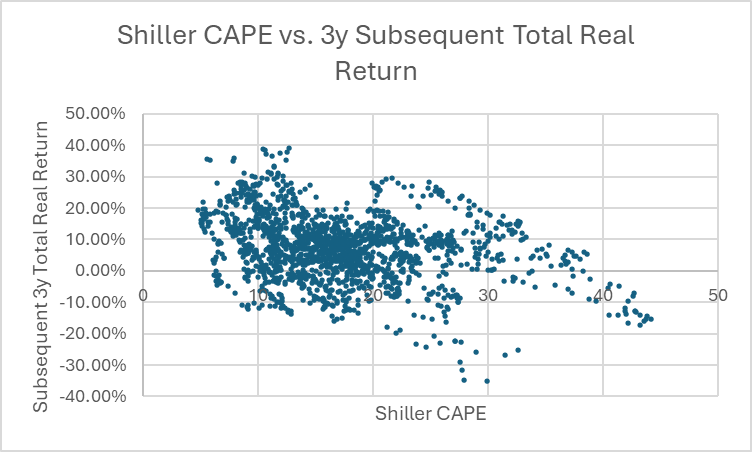
Even with stretched valuations in the top 3.7% of observations, you are still about 40% likely to get positive 3-year returns buying in at a Shiller CAPE >34. The numbers look even better at a “high” Shiller CAPE of 28.
The 1-year return was the most surprising for me.
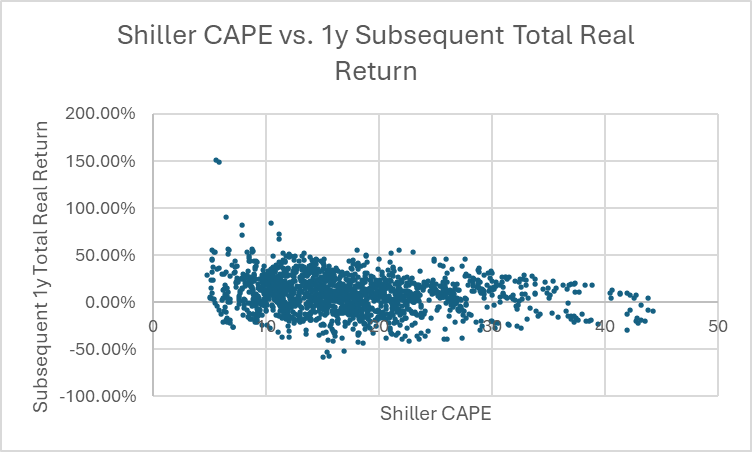
At an elevated Shiller CAPE of 34, there is a 50% chance that the market will advance over the following 12 months! I interpret this as an “irrational” market—from a valuation standpoint—continuing to stay irrational, or get even more irrational.
The interaction between Shiller CAPE and market outcomes is a story of regime shifts, not independent observations
Shiller CAPE for 2018 (when I rebalanced my portfolio) peaked at 33.3. Episodes where Shiller CAPE rose above 34 are not evenly distributed across the 1,860 monthly observations since 1871, but rather clustered in two episodes: 1998-2001 and 2021-2025. Even past bubbles like 1929 and 2008 saw CAPE rise only to 32.6 and 27.5, respectively.
A few takeaways:
The current 2025 bubble is indeed extreme, as measured by traditional valuation metrics
I think John Hussman is correct to be wary. Based on my analysis, 2001 probably is a good analogy, even if the current environment feels much less euphoric.
However, the base rate of an overvalued market delivering positive returns over the subsequent 12 months is at least 50%, depending on how you define “overvalued”. Bears can be wrong for a long time before they are right.
In any case, 2001 and 2025 appear to “cut from a different cloth” than equity bubbles during the 1900s. Numbers can get much more extreme in modern markets. I will speculate on why in a future post.
N=2, not n=69
Although Shiller’s data show 69 monthly observations of CAPE > 34, the reality is that these are clustered in only two episodes, the 2000 bubble and the current one. I can’t draw any strong statistical inference from this.
In the two cases of CAPE Shiller >34, one ended in a severe crash, and the other is ongoing.
An interventionist central bank is positive for equity investors—the “Fed put” is real
This one surprised me. At no point from 2004-2009 did subsequent 10-year real equity returns fall below 4.40%.
Even if you bought at the equity market peak in December 2007, with a crushing 1-year return of -39.29%, your 10-year return was +6.61% real.
I interpret this as the market falling from an overvalued peak, and the central bank rescuing it from the fall and pushing it to an even more overvalued level, as measured by the price you pay for $1 of historical, inflation-adjusted earnings.
How should I respond to an overvalued market?
Here’s what I concluded from this analysis:
- The long-term real return of U.S. equities is 7.07% since 1871.
- Shiller CAPE is not enough to time valuation peaks. If I’m an individual investor that is constantly putting small clips into the market every month, even 12-15 months of investing at negative 10y returns doesn't matter when it's a small amount of the accrued portfolio. There might be better investment rules for shifting asset allocations, but CAPE Shiller alone isn't it.
- This is all independent of regime shifts like Bretton Woods, Fed QE, government deficits, corporate tax policy, etc. If there was a major regime shift, like laws enhancing the bargaining power of labor, aggressive antitrust enforcement, or similar, then the long-term 7.07% might deserve to be questioned. But we aren’t there yet.
- There might be better rules to shift allocations within equity market sectors, but this analysis doesn’t capture them. It is worth looking into, however.
I should remain invested, unless I have better reasons not to be.