Social Security Will Run Out of Money in 2033, and That’s Just the Beginning of Its Problems
Social Security's trust fund depletes in 2033, and even then the SSA's fertility and labor share assumptions are too optimistic. The hole is bigger than projected.
We discuss fiscal policy in Week 5 of my capital markets class. I close the lecture (and ruin my students’ weekend) by showing them that Social Security will run out of surpluses in 2033, with ongoing income only being sufficient to pay 77% of scheduled benefits[1] from that point forward.
- Social Security's OASI trust fund will be depleted in 2033, at which point benefits get cut to 77 cents on the dollar—and that’s the best-case scenario
- The SSA's fertility assumptions are too high: CBO and Census both project TFR falling to 1.5-1.6, while SSA assumes a recovery to 1.9
- The SSA assumes labor's share of GDP recovers to 61% with no policy mechanism to get there. If it stays at 58%, the funding hole is even larger than projected
I think most informed people have a sense that Social Security is in trouble, but few are aware how close the day of reckoning is. Unfortunately, the Social Security Administration (SSA) Trustees’ 2025 Report rests on assumptions that themselves are too optimistic. I think Social Security is in even bigger trouble than the headline suggests.
The Pay-As-You-Go Problem
Social Security, formally called the Old-Age, Survivors, and Disability Insurance (OASDI) program, became law in 1935 during the Great Depression and began making payments in 1937.[2] It is structured as a “pay-as-you-go” program, meaning that current tax receipts are used to fund current benefits. That’s different from a 401(k), where I invest money, it sits there and accumulates returns, and I withdraw my own money plus gains many years later.
The basic issue with a pay-as-you-go program is that it only works if current tax receipts are equal to or greater than the current benefits being paid. That was fine in the 1930s when there was a relatively large workforce supporting a relatively small number of retirees, and the retirees themselves did not have long post-retirement lifespans.
Today, with falling birthrates and longer lifespans, there are fewer workers supporting each retiree, and the retirees themselves are living longer and therefore collecting benefits longer.[3]
Social Security’s Current Fiscal Situation
Social Security is split into two legally distinct funds, the Old-Age and Survivors Insurance (OASI) fund and the Disability Insurance (DI) fund. OASI is the main retirement pension fund most retirees rely on. Here are their 2024 results:
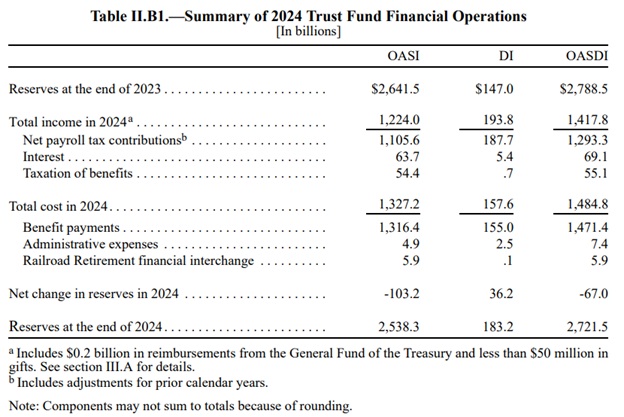
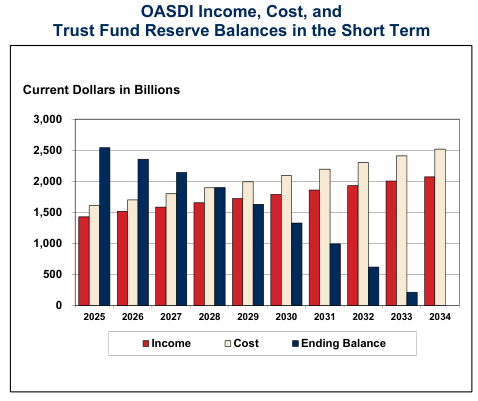
The SSA projects that DI will remain fiscally solvent through 2100. The bigger fund, OASI, has reserves of $2.6 trillion and has been dipping into those reserves since 2021 to cover benefits. It was able to build up a reserve because payroll tax receipts exceeded benefits for most of its history. In 2024, however, OASI drew down $103 billion of its reserves. These reserves will run out in 2033,[4] and incoming tax receipts will only be sufficient to cover 77% of promised benefits to retirees.
Source: “Agency Financial Report, Fiscal Year 2025,” p. 34
Moreover, the SSA’s baseline projection shows that Social Security’s deficit will grow over time, peaking at about -5.50% of taxable payroll in 2080.[5] (I interpret this as payroll taxes needing to be increased by roughly that amount, in that year, to cover expected costs assuming that people don’t work less in response to higher taxes.)
Social Security’s Position Is Worse Than the Government Assumes
The Trustees’ Report acknowledges that OASI is in financial trouble—the actuarial deficit for both funds combined will fall short by 3.82% of taxable payroll over the next 75 years (SSA says payroll taxes need to be hiked by 3.65% between 2025-2099 to fully cover program costs—the difference between the two figures is probably interest earned on taxes raised today).[6] [7] I think the program is in worse trouble than the report indicates because the Trustees are relying on assumptions that are themselves too optimistic.
The SSA’s Demographic Assumptions Are Too Rosy
Social Security’s ability to raise revenue in the future depends on the size of the payroll tax base. The Report makes two incorrect assumptions about the future payroll tax base—total fertility rates and labor’s share of GDP—that overestimate its future tax receipts.
In other words, the budget hole in Social Security is likely to be bigger than the Report projects and therefore future tax hikes needed to cover the shortfall will be bigger than projected.
SSA Is Hoping for a Baby Boom That Won’t Happen
The Total Fertility Rate (TFR) measures how many children the average woman will have over the course of her lifetime. The replacement rate that keeps the population constant is 2.1 children per woman. Over the last thirty years, virtually all developed countries have seen the TFR fall below the 2.1 replacement rate, with some far below the level.
The SSA projects that the U.S. TFR will return to 1.9 by 2045, up from 1.62 in 2023.[8] I find this extremely farfetched. Implicitly, the SSA is assuming that whatever factor is causing women to have fewer children is cyclical and not structural. Global data—which show that birth rates are falling in almost every country—suggest the trend goes in one direction and that is down.
Two other government sources—the Congressional Budget Office (CBO) and the Census Bureau—directly contradict the SSA’s assumptions. The CBO projects that the average U.S. fertility rate will fall to 1.50 children per woman by 2032 and remain there until at least mid-century, while the Census projects that TFR will fall to 1.60 by 2056. There is further downside risk to these estimates if immigration policy stays on its current course, as foreign-born women tend to have more children than U.S.-born women.
I think the SSA’s estimate of 1.9 stabilized TFR is bogus. Developed countries can go much lower, with TFRs like 1.39 (Germany), 1.2 (Japan), 0.97 (Singapore), and 0.72 (South Korea).[9] And these countries are at levels far below 1.9 today. Who knows what they will look like in 2045.
In the SSA’s worst-case scenario, they think that TFR will fall to 1.6 per woman and stay there. In that scenario, the actuarial balance of the program would be -4.49% from 2025-2099 rather than the -3.82% in the baseline scenario.[10] Even that is too optimistic. What SSA fails to consider is if the U.S. follows the trend of countries like Germany and Japan and sees TFR fall to a sub-1.5 level. This would imply sharper benefit cuts, higher payroll taxes, or greater government debt than even SSA’s worst-case scenario projects.
SSA Expects to Tax Workers on Money They Won’t Have
Social Security’s future revenue is a function of two things: the payroll tax rate, and the size of the payroll tax base.
The payroll tax base maps to labor’s share of GDP—that is, the total amount of national production that is paid out in the form of wages and salaries. Labor’s share of GDP has fallen from 62.1% from 1969-2019 to 58.4% in 2024.[11] This means that workers are getting a smaller and smaller share of national income, with owners of capital getting more.
The SSA report assumes that labor’s share of GDP will reverse the trend of recent decades and return to about 61.2% of GDP by 2034. If this happens, it will mean that Social Security gets to collect tax revenue from a broader tax base.
I think this is a dangerous assumption to make. The SSA report makes no assertion as to how labor’s share of GDP will be restored to 61%. I think they are just assuming that it is going to happen automatically, even though the trend in national economic policy has been to favor owners of capital.
If labor’s share of GDP stays at the current 58.4%, or even declines further, then Social Security’s solvency would be even worse than the SSA is projecting.
Congress Will Fix This, And It Will Hurt More Than You Think
The good news: Congress will fix this problem.
The bad news: Congress will wait until the last minute (i.e., the 2032 presidential election cycle) to do so, and the pain is going to be worse than what the SSA is forecasting.
As it stands, the SSA believes that Social Security’s 75-year revenue shortfall can be fixed with a payroll tax increase of 3.65% starting in 2025. Unfortunately, the tax hike (or benefits reduction) will have to be larger than that, because
- Congress won’t get started on this until 2032, when they should have started in 2025 or earlier,
- There will be fewer future workers than the SSA predicts because their birth rate assumptions are too high, and
- Unless policy changes are put in place to restore labor’s share of national income to its longer-term average, even a ~3.5-4% payroll tax hike won’t be enough because there won’t be enough payroll to tax.
Policy Implication: Lower Valuations?
A 4% or greater increase on already-squeezed U.S. workers’ payroll taxes is going to enormously unpopular. That leaves three options: benefit reductions, broadening the tax base, and deficit spending.
Benefit Reductions: I think some degree of benefit reductions are likely, as other developed countries have already taken this approach (the Netherlands, Germany, Spain, others). The program initially envisaged much shorter total lifespans and economically productive lifespans than people currently enjoy.
Broadening the Base: If labor’s share of GDP doesn’t return to the 62%+ range, I think the tax base will have to be broadened to include capital in some way. People are already talking about taxing compute, data centers, or AI tokens in some way. This approach is likely to be more politically digestible than payroll tax increases.
Deficits: Politicians could kick the can down the road as usual and borrow money to cover the shortfall.
Base broadening and deficits likely mean lower valuations, although later retirement ages should mean higher GDP. Taxing capital will reduce valuations from reducing the cash flow on investments, while deficits should reduce valuations stemming from higher interest rates from greater government bond issuance.
None of these options are painless, and the longer Congress waits, the fewer good ones remain.
[1] The average monthly Social Security check today is about $2,071. 77% would mean the monthly payment would go down to $1,594, adjusted for inflation.
[2] “Social Security (United States)”, Wikipedia
[3] The ratio of workers to retirees was 3.2-3.4 between 1974 and 2008, and then started falling to the current level of 2.7 workers per retiree in 2024. It will fall to 2.3 by 2040. (SSA Trustees Report 2025, p. 15)
[4] SSA Trustees Report 2025, p. 3
[5] SSA Trustees Report 2025, p. 58
[6] SSA Trustees Report 2025, p. 5
[7] SSA Trustees Report 2025, p. 28
[8] SSA Trustees Report 2025, p. 91
[9] “List of Countries by Total Fertility Rate,” https://en.wikipedia.org/wiki/List_of_countries_by_total_fertility_rate
[10] SSA Trustees Report 2025, p. 192
[11] SSA Trustees Report 2025, p. 110